Use this tool to track your outcome data/results over time for a project. On this page, you will find an example of a Run Chart, instructions for using the Run Chart, and downloads for both a Run Chart example and the Run Chart template.
Template Preview
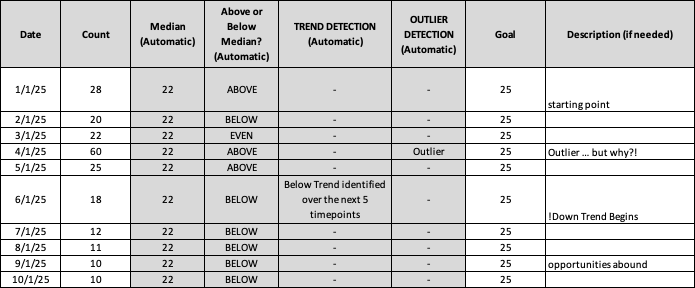
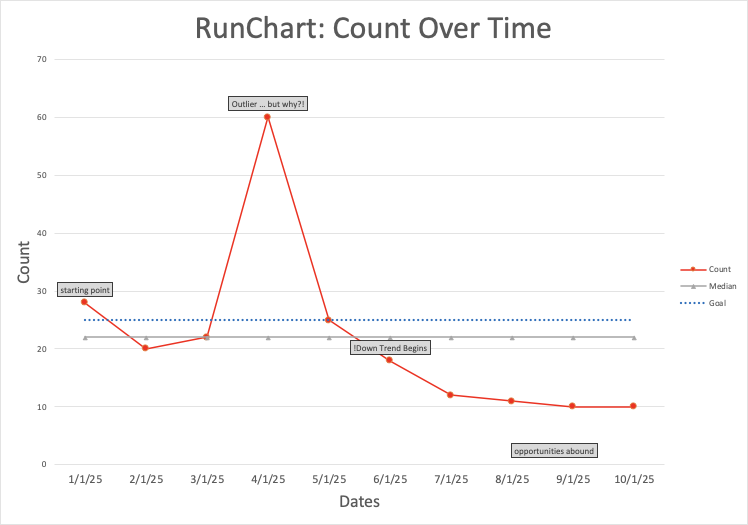
Below is an image of an example of a Run Chart. The first image shows an example grid; select the arrow to swipe to the Run Chart that is returned from this example.
 Example: Fillable Grid
-
Example: Run Chart
Instructions
A downloadable version of the instructions can be found below the steps:
- Be sure that rows 1 and 2 of the Run Chart are always populated.
- Dates can be in any format or time duration. Users can adapt it based on the needs of their chart.
- When a trend 5 points under or over the mean has been recognized, the trend column will be automatically updated to detect this change.
- The mean is automatically calculated and adjusts based on the overall data inputted into the table.
- An outlier is identified as an item 2x the standard deviation from the mean. This will be identified (if it emerges) in that column.
- Notes can be written into the Notes Column – which will appear dynamically in the chart.
- This chart is limited to 99 data points. Any items beyond 99 will not be displayed in the chart.