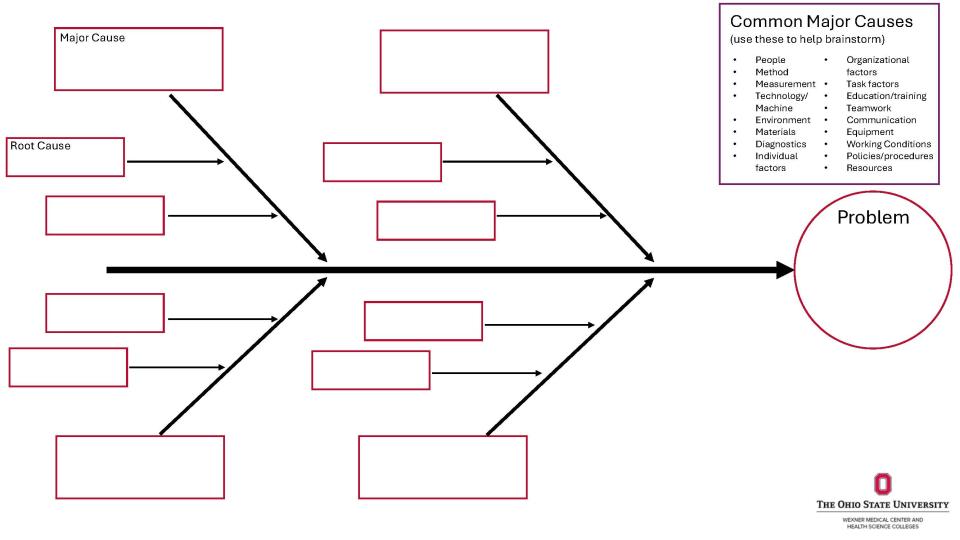
This video provides an overview of how to use the fishbone diagram (also known as an Ishikawa or cause-and-effect diagram) as a tool to identify and analyze multiple root causes of complex problems, using a healthcare-based example. Fishbone Diagram templates are provided below to support projects with different needs, including both “small” and “large” versions, with the large version offering additional space to document major and root causes. Each version is available in both PDF and PowerPoint formats.
Video
Template Preview
References
Kane R, Kane R. How to Use the Fishbone Tool for Root Cause Analysis. Centers for Medicare & Medicaid Services. 2024. Accessed November 20, 2024.
ChatGPT was used to create the example.
Content Development
Primary script writer
- Najhee Purdy, BS
Script collaborators
- Rachel Arpin, EdD
- Keri Cooper, MBA, RN, CPHQ
- Jennifer Eramo, MSN, RN
- Steven Holfinger, MD, MS
- Erin Hueser, MBOE, RT, LSSBB; CCMP
- Shana McGrath, MA, CCC-SLP
- Catherine Quatman-Yates, DPT, PhD
- Lauren Teuschler, M.Ed
Acknowledged contributors
- Riley Summers, BS
- Jamie L. Lenzo, M.Ed.
Video Development

Video animation and production by Robbie McCord, MS.Ed., Instructional Design Senior Specialist in the Office of Curriculum and Scholarship for the College of Medicine. Visit the OCS site to book an instructional project consultation.